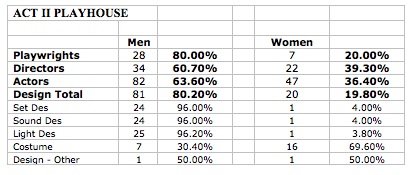
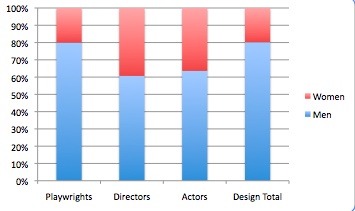
Yesterday we looked at the folks on the upper end. Now let’s look at some people in the middle. Here are data sets for four mid sized companies: The Lantern, Interact, Theatre Exile, and Act II Playhouse.
Using this website I found the “revenue” listed for each of these companies to be in the mid to high hundred thousands. I’m assuming that’s for the most recent tax filing. For comparison yesterday’s figures for the Arden, People’s Light, PTC, and Wilma had revenues listed at 5.29 million, 4.11 million, 3.95 million, and 3.64 million respectively. So on the whole we’re looking roughly at an order of magnitude smaller.
This is useful to note for two semi-self evident reasons:
1) Larger companies tend to employ more people and therefore a difference in representation in these companies has a higher impact on the community as a whole.
2) We can make a reasonable assumption that jobs at better funded theaters will tend to pay at a higher pay grade.
This is obviously not always true in every instance, but gives a useful bit of context when comparing numbers across company sizes. Still, unfair representation is, obviously, unfair at any scale.


A
PS –
1) Act II’s data on designers was particularly tough to find (especially for seasons 08/09 and 09/10). This is why the total numbers of designers is lower than the expected based on corresponding number of productions. This data is less complete than the other theaters’ info. If you’d like the raw data feel free to ask.
2) Again, if you want to know how I calculated these numbers you can check back on the PS from yesterday’s post.
