Yesterday we looked at the folks on the upper end. Now let’s look at some people in the middle. Here are data sets for four mid sized companies: The Lantern, Interact, Theatre Exile, and Act II Playhouse.
Using this website I found the “revenue” listed for each of these companies to be in the mid to high hundred thousands. I’m assuming that’s for the most recent tax filing. For comparison yesterday’s figures for the Arden, People’s Light, PTC, and Wilma had revenues listed at 5.29 million, 4.11 million, 3.95 million, and 3.64 million respectively. So on the whole we’re looking roughly at an order of magnitude smaller.
This is useful to note for two semi-self evident reasons:
1) Larger companies tend to employ more people and therefore a difference in representation in these companies has a higher impact on the community as a whole.
2) We can make a reasonable assumption that jobs at better funded theaters will tend to pay at a higher pay grade.
This is obviously not always true in every instance, but gives a useful bit of context when comparing numbers across company sizes. Still, unfair representation is, obviously, unfair at any scale.


A
PS –
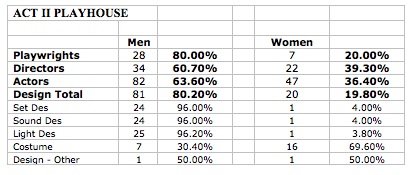
1) Act II’s data on designers was particularly tough to find (especially for seasons 08/09 and 09/10). This is why the total numbers of designers is lower than the expected based on corresponding number of productions. This data is less complete than the other theaters’ info. If you’d like the raw data feel free to ask.
2) Again, if you want to know how I calculated these numbers you can check back on the PS from yesterday’s post.

Okay, so. I’ve been thinking a lot lately about anecdotal evidence that suggests that set and lighting designers are paid more, on average, than costume designers. (A claim that I have no actual data to back up, just offhanded conversations with production managers and a few uncomfortable moments when LD and SD friends have complained about their fees and I’ve had to control the shocked expression on my face when I realize they are being paid more than I am.) I had always sort of written it off as “yeah, but those people need expensive software to keep up with their jobs; I’m sure their overhead is higher.”
And then, uh — these numbers keep jumping out at me and for the first time, it’s starting to feel uncomfortably like a gender thing. For the first time I’m realizing that of all the categories that you’re surveying, I work in the ONLY one that is predominantly female. I mean, maybe it’s just coincidence – or maybe there’s something larger at work here that is making me feel super icky.
I think that this is entirely possible. And this is when I REALLY wish I had some access to data to really find out whether this kind of stuff is happening. Even working anecdotally from 990 info it seems like there’s a trend between larger sized companies and larger gender disparity. So it makes me feel like I might see some REAL scary trends if I not only were able to look at blanket numbers for how many actors, directors and designers were male and female but how much they’re actually getting paid.